Try it out
- Sentinel-2 NDVI
- Land Surface Temperature
NDVI of Sentinel-2
Let's calculate the NDVI for a Sentinel-2 Scene.
We can use the command line tool "curl" for this, but any HTTP GET and POST client will do. So open up a terminal and type:
curl -u 'demouser:gu3st!pa55w0rd' \
     -X POST \
     'https://actinia.mundialis.de/latest/sentinel2_process/ndvi/S2A_MSIL1C_20160818T032052_N0204_R032_T48LVP_20160818T032053'
Response:
click here to view
As this is an asynchronous request, you'll receive a status URL. Keep polling the status URL it, until the status is "finished":
                curl -u 'demouser:gu3st!pa55w0rd' \
                -X GET \
                'https://actinia.mundialis.de/api/v1/resources/demouser/resource_id-87c6ddf2-0911-4e16-95eb-a4ea466f18ac'
Then you will receive a long json response like this:
click here to view
You can see that the status is now "finished". The result can be seen in the "urls" section:
                "urls": {
                    "resources": [
                    "https://actinia.mundialis.de/api/v1/resource/demouser/resource_id-87c6ddf2-0911-4e16-95eb-a4ea466f18ac/tmpuvndd_n7.png",
                    "https://actinia.mundialis.de/api/v1/resource/demouser/resource_id-87c6ddf2-0911-4e16-95eb-a4ea466f18ac/ndvi.tiff"
                    ],
                    "status": "https://actinia.mundialis.de/api/v1/resources/demouser/resource_id-87c6ddf2-0911-4e16-95eb-a4ea466f18ac"
                },
Here you'll find a quicklook image in PNG format as well as the processed tiff. To download them, run:
                curl -u 'demouser:gu3st!pa55w0rd' \
                -X GET \
                'https://actinia.mundialis.de/api/v1/resource/demouser/resource_id-87c6ddf2-0911-4e16-95eb-a4ea466f18ac/tmpuvndd_n7.png' \
                > ndvi.png

                curl -u 'demouser:gu3st!pa55w0rd' \
                -X GET \
                'https://actinia.mundialis.de/api/v1/resource/demouser/resource_id-87c6ddf2-0911-4e16-95eb-a4ea466f18ac/ndvi.tiff' \
                > ndvi.tiff
And now you can look at them with e.g
see ndvi.png
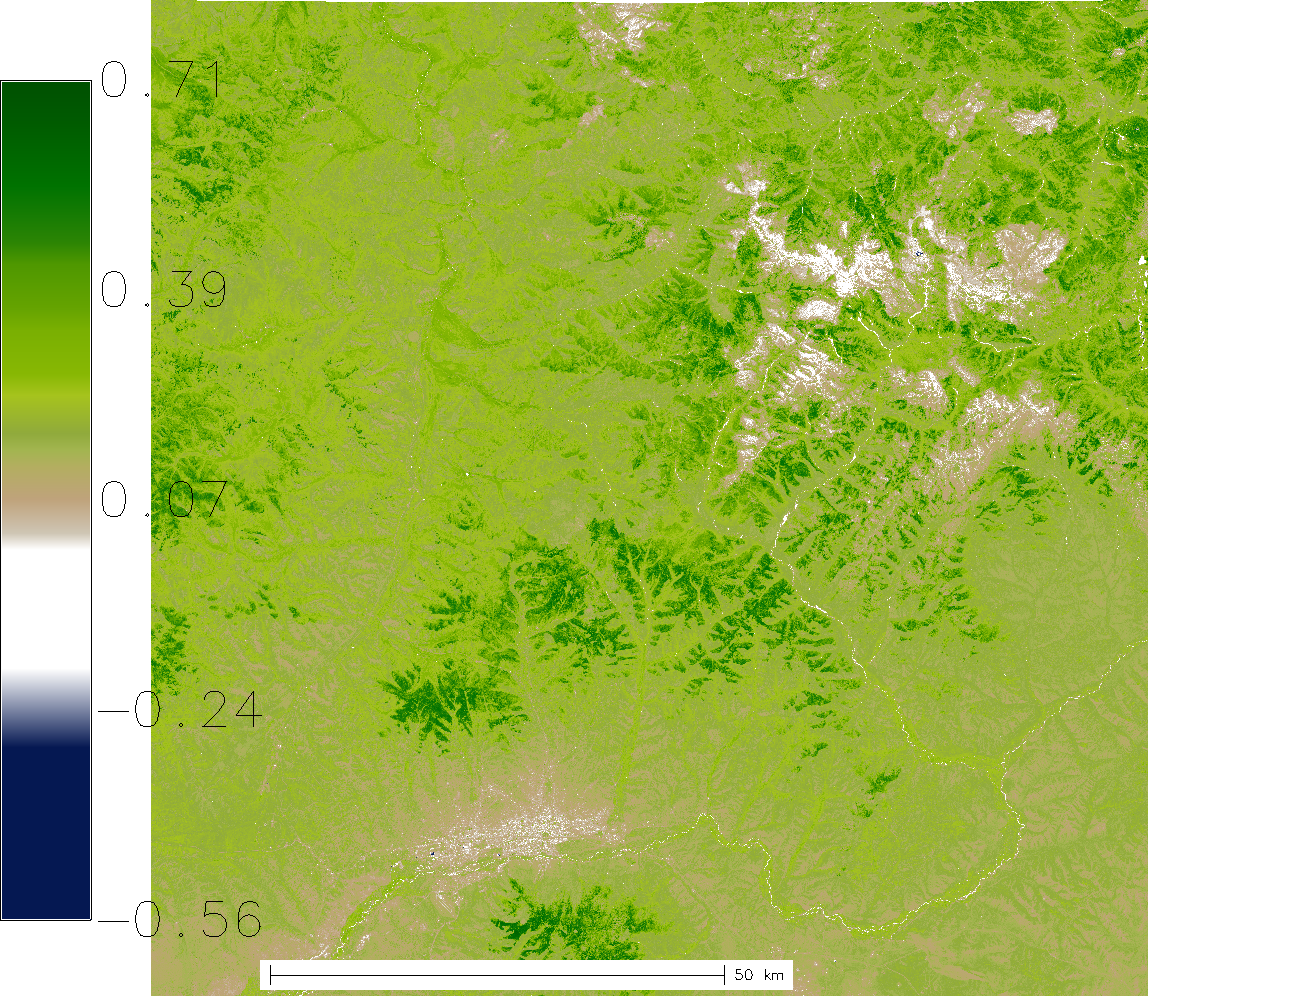
The quicklook will look like this:

Or maybe you are more the statistics person? Then you may have seen the "process_results" section in the response above:
"process_results": [
    {
        "cells": 120900888.0,
        "coeff_var": 44.8857169907856,
        "max": 0.71156895160675,
        "mean": 0.214685931299146,
        "mean_of_abs": 0.215134492278408,
        "min": -0.561938941478729,
        "n": 120190632.0,
        "name": "ndvi",
        "null_cells": 710256.0,
        "range": 1.27350789308548,
        "stddev": 0.0963633195419669,
        "sum": 25803237.7643529,
        "variance": 0.00928588935314722
    }
],
This section will give you all the zonal statistics about the processed result.

